Help
Exam processing procedure
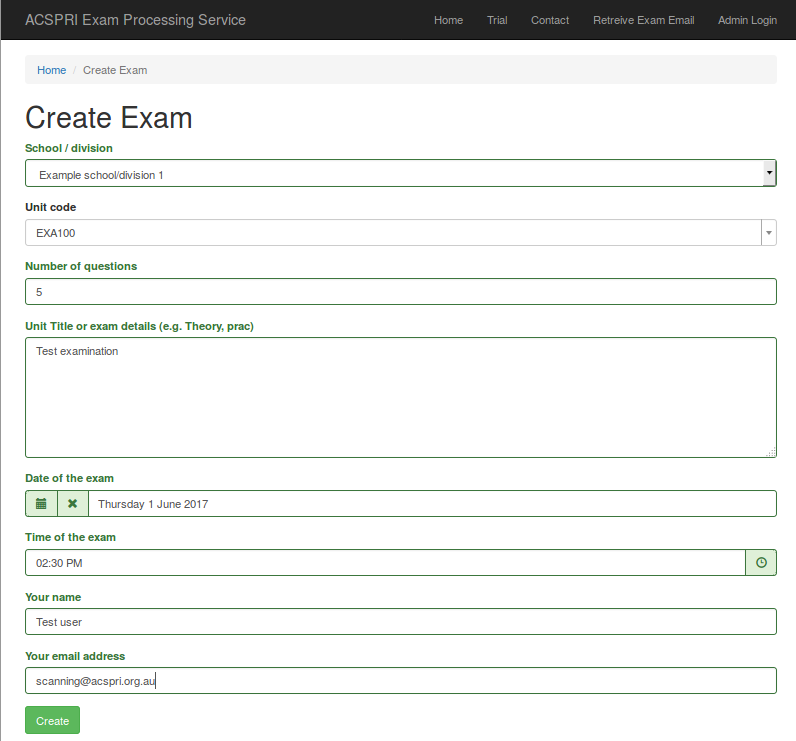
After clicking on the "Create exam" button, begin by entering a unit code. Then enter in the number of questions on your paper. Give a detailed description of the exam to make sure you will be able to identify it later. Select the date and time of the exam, the confirm your name and email address. Once you are ready, click the "Create" button.
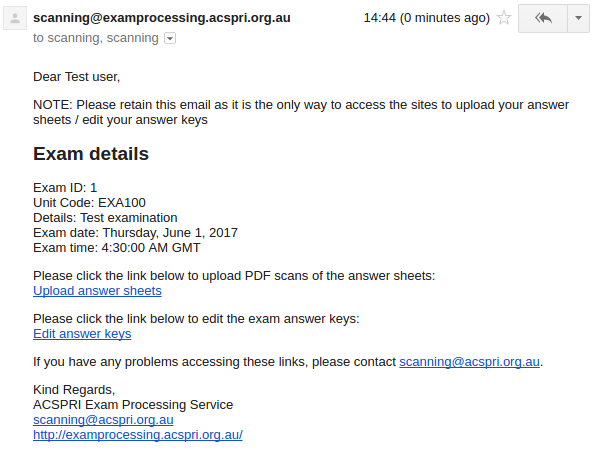
You will receive an email similar to the one shown above. Please retain this email as it has direct links to return to the page to upload the scanned papers
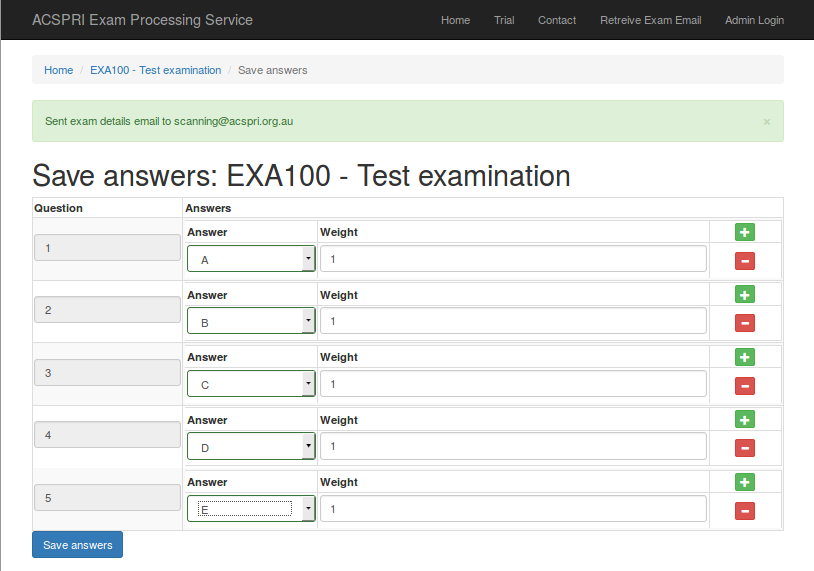
Directly after creating the exam, you can enter in the answer keys. Choose the appropriate answer to each question from the dropdown boxes. The "Weight" determines the number of points a student should receive if they select the answer provided. You can add multiple possible answers to a question by clicking the red "+" icon on the row for each question. Click on "Save answers" when you are done. Please note if you make a mistake, you can come back to this page at any time from the link in the email sent to you.
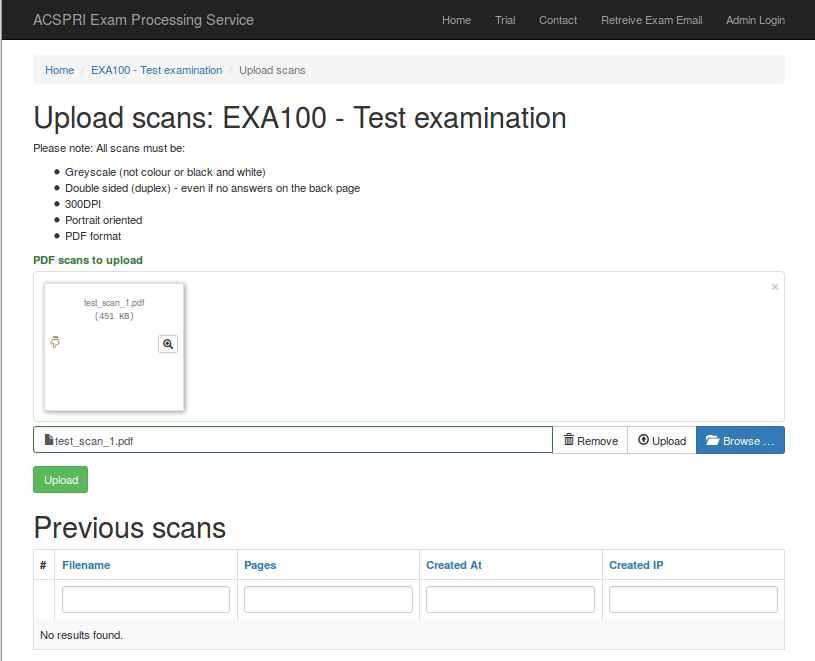
Once your answers are saved, you can return to the email sent to you to upload scanned papers to the system. Please note scans must be double sided (duplex) if responses are written on the back page (more than 40 questions). All scans should be done at 300DPI on the "Greyscale/Grayscale" scanner setting to a PDF file. You can scan multiple papers in to one PDF file. Once you have these files, either browse for them using the "Browse" link or drag and drop them on the form, then click on "Upload". You should receive a message on the screen once the the files have been uploaded, and also they should appear in the list "Previous scans".
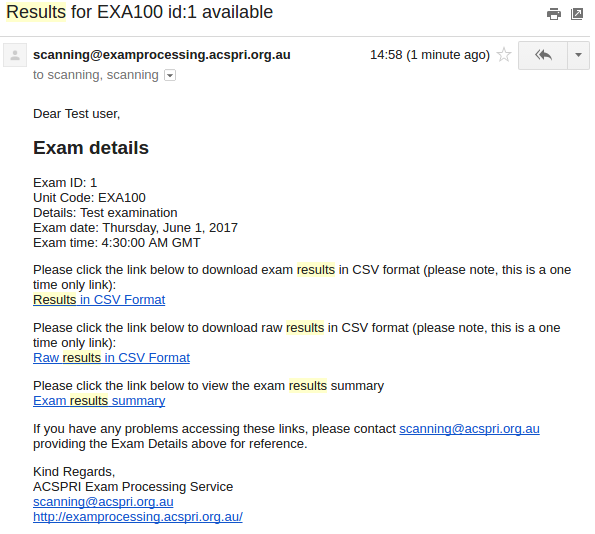
Within 24 hours you should receive an email containg a link to download your results and view a summary report. If you do not receive an email within this time, please contact scanning@acspri.org.au and quote the exam ID number in the original exam email.
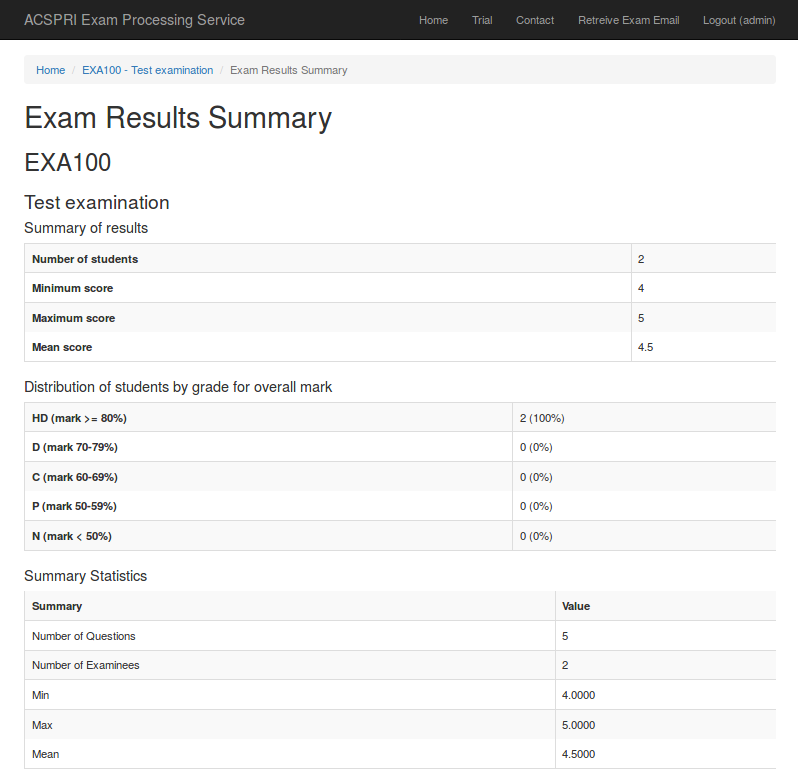
The results summary contains some basic statistics about the examination (i.e. Number of students, minimum score, maximum score, mean score, etc) along with a detailed item discrimination report. There are more details about the item discrimination report below
Item discrimination report
Item Response
The "Item Response" table displays a summary of each item in the exam
- Question
- The question number
- Option (Score)
- The response. The first row for a question always corresponds to the correct response. It is labelled as "Overall"
- The number in the brackets indicate the weight assigned to a response
- Difficulty
- The proportion of students who selected this response for this item. E.g. 0.9215 = 92.15% of students selected this response
- Standard Deviation
- Standard deviation for this response (the square of this is the item variance)
- Discrimination
- A correlation between the item score and the total test score
- Also known as "item total correlation"
- Positive item-total correlations mean high-scoring examinees tend to get this item correct, and low scoring examinees tend to get this item wrong.
- Higher values indicate a larger amount of discrimination
- Values near 0 indicate little to no discrimination
- Negative values indicate a problem – this means low scoring examinees tend to get the item correct – you may need to check your answer key is correct.
- To assist with visualising the table, items in red have a discrimination of less than 0.1, items in orange have a discrimination between 0.1 and 0.3, and items in green have a discrimination > 0.3
|
Question |
Option (Score) |
Difficulty |
Standard Deviation |
Discrimination |
|---|---|---|---|---|
|
Q1 |
Overall |
0.9215 |
0.2692 |
0.0635 |
|
A (0.0) |
0.0000 |
0.0000 |
NaN | |
|
B (0.0) |
0.0666 |
0.2495 |
-0.3445 | |
|
C (0.0) |
0.0119 |
0.1087 |
-0.1097 | |
|
D (1.0) |
0.9215 |
0.2692 |
0.0635 | |
|
Q2 |
Overall |
0.5751 |
0.4948 |
0.0115 |
|
A (0.0) |
0.0495 |
0.2171 |
-0.2541 | |
|
B (0.0) |
0.1416 |
0.3490 |
-0.2839 | |
|
C (0.0) |
0.2338 |
0.4236 |
-0.4142 | |
|
D (1.0) |
0.5751 |
0.4948 |
0.0115 | |
|
Q3 |
Overall |
0.4488 |
0.4978 |
0.2452 |
|
A (0.0) |
0.3140 |
0.4645 |
-0.4987 | |
|
B (0.0) |
0.1229 |
0.3286 |
-0.4203 | |
|
C (1.0) |
0.4488 |
0.4978 |
0.2452 | |
|
D (0.0) |
0.1109 |
0.3143 |
-0.2887 | |
|
Q4 |
Overall |
0.5307 |
0.4995 |
0.0960 |
|
A (0.0) |
0.1758 |
0.3809 |
-0.3346 | |
|
B (1.0) |
0.5307 |
0.4995 |
0.0960 | |
|
C (0.0) |
0.2167 |
0.4124 |
-0.4669 | |
|
D (0.0) |
0.0751 |
0.2638 |
-0.2428 | |
|
Q5 |
Overall |
0.8191 |
0.3853 |
0.1085 |
|
A (0.0) |
0.1229 |
0.3286 |
-0.3967 | |
|
B (1.0) |
0.8191 |
0.3853 |
0.1085 | |
|
C (0.0) |
0.0273 |
0.1631 |
-0.2640 | |
|
D (0.0) |
0.0307 |
0.1727 |
-0.2186 | |
|
Q6 |
Overall |
0.5529 |
0.4976 |
0.3081 |
|
A (1.0) |
0.5529 |
0.4976 |
0.3081 | |
|
B (0.0) |
0.1468 |
0.3542 |
-0.5018 | |
|
C (0.0) |
0.1553 |
0.3625 |
-0.4057 | |
|
D (0.0) |
0.1416 |
0.3490 |
-0.3849 | |
|
Q7 |
Overall |
0.7082 |
0.4550 |
0.1932 |
|
A (0.0) |
0.0853 |
0.2796 |
-0.3130 | |
|
B (0.0) |
0.0683 |
0.2524 |
-0.2776 | |
|
C (1.0) |
0.7082 |
0.4550 |
0.1932 | |
|
D (0.0) |
0.1365 |
0.3436 |
-0.5052 | |
|
Q8 |
Overall |
0.4727 |
0.4997 |
0.1612 |
|
A (1.0) |
0.4727 |
0.4997 |
0.1612 | |
|
B (0.0) |
0.0666 |
0.2495 |
-0.3190 | |
|
C (0.0) |
0.2935 |
0.4558 |
-0.5032 | |
|
D (0.0) |
0.1672 |
0.3735 |
-0.3033 | |
|
Q9 |
Overall |
0.9096 |
0.2871 |
0.1478 |
|
A (0.0) |
0.0085 |
0.0921 |
-0.1248 | |
|
B (1.0) |
0.9096 |
0.2871 |
0.1478 | |
|
C (0.0) |
0.0563 |
0.2307 |
-0.3376 | |
|
D (0.0) |
0.0256 |
0.1581 |
-0.2862 | |
|
Q10 |
Overall |
0.8072 |
0.3949 |
0.2336 |
|
A (0.0) |
0.1109 |
0.3143 |
-0.4832 | |
|
B (0.0) |
0.0307 |
0.1727 |
-0.2461 | |
|
C (1.0) |
0.8072 |
0.3949 |
0.2336 | |
|
D (0.0) |
0.0495 |
0.2171 |
-0.3012 |
Reliablity Analysis
Reliability refers to the reproducibility of test scores. If reliability is high (closer to 1), test scores from one test should be similar to another test that was intended to measure the same thing.
The table below contains a range of reliability measures. Multiple measures are reported to account for different sources of measurement error.
Reliability values range from 0 to 1. A large reliability value indicates that variance in the observed score (exam score) is due to the true score (what was intended to be measured). A low reliability value (near 0) indicates most of the observed score variance is due to measurement error.
SEM (Standard Error of Measurement) quantifies the amount of uncertainty with the exam score. This is the difference between the score a student obtains on a test (an observed score) and the hypothetical "true score" that the same student would obtain if a test could measure the student's achievement level with perfect accuracy. A student will have an exam score within one SEM of the true score about 68 percent of the time and within two SEMs of the true score about 95 percent of the time.
|
Method |
Estimate |
95%CI(low) |
95%CI(high) |
SEM |
|---|---|---|---|---|
|
Guttman's L2 |
0.4269 |
0.3552 |
0.4937 |
1.3086 |
|
Coefficient Alpha |
0.4038 |
0.3291 |
0.4732 |
1.3348 |
|
Feldt-Gilmer |
0.4278 |
0.3562 |
0.4945 |
1.3076 |
|
Feldt-Brennan |
0.4105 |
0.3368 |
0.4792 |
1.3272 |
|
Raju's Beta |
0.4038 |
0.3291 |
0.4732 |
1.3348 |
Reliability If Item Deleted
This table describes the result of the reliability measures assuming the item listed has been removed from the exam. An increase to the reliability would suggest that the item is not consistent with the other items in the exam. For example, removing Q2 appears to increase the reliability of the exam as a whole.
|
Item |
Guttman's L2 |
Coefficient Alpha |
Feldt-Gilmer |
Feldt-Brennan |
Raju's Beta |
|---|---|---|---|---|---|
|
Q1 |
0.4260 |
0.4047 |
0.4287 |
0.4096 |
0.4047 |
|
Q2 |
0.4588 |
0.4406 |
0.4588 |
0.4494 |
0.4406 |
|
Q3 |
0.3650 |
0.3380 |
0.3695 |
0.3444 |
0.3380 |
|
Q4 |
0.4303 |
0.4055 |
0.4315 |
0.4139 |
0.4055 |
|
Q5 |
0.4187 |
0.3949 |
0.4192 |
0.4023 |
0.3949 |
|
Q6 |
0.3342 |
0.3078 |
0.3301 |
0.3128 |
0.3078 |
|
Q7 |
0.3854 |
0.3631 |
0.3884 |
0.3697 |
0.3631 |
|
Q8 |
0.3989 |
0.3767 |
0.4035 |
0.3838 |
0.3767 |
|
Q9 |
0.4093 |
0.3845 |
0.4136 |
0.3904 |
0.3845 |
|
Q10 |
0.3790 |
0.3510 |
0.3869 |
0.3584 |
0.3510 |
Conditional Standard Error Of Measurement
The Conditional Standard Error of Measurement (CSEM) is the SEM at a specific score level.
|
True Score |
CSEM |
|---|---|
|
0 |
0.000 |
|
1 |
0.902 |
|
2 |
1.202 |
|
3 |
1.377 |
|
4 |
1.472 |
|
5 |
1.503 |
|
6 |
1.472 |
|
7 |
1.377 |
|
8 |
1.202 |
|
9 |
0.902 |
|
10 |
0.000 |
Reference:
Meyer, J. Patrick. Applied Measurement with JMetrik. Routledge, 2014.
The fine print
This system is based on the open source paper form processing system, queXF, also developed by ACSPRI. It replaces the need for specialised mark recognition hardware, and related printing, such as Scantron devices. Multiple choice examination papers can be printed in black and white or colour using regular printers, and scanned in PDF format using regular scanners. Exam participants can fill in the sheet with a pen or dark pencil. Once the papers are uploaded, the queXF mark recognition software attempts to automatically process the papers. If there are any results it cannot be 100% satisfied with, these are sent to verification staff who identify the selected response. Once all papers for an examination are processed, the bulk results are checked for any errors or unexpected results, and then sent to the examination creator via a one-time link secure download. In addition to the students score in CSV/spreadsheet format, raw results are provided (each response written by the student) along with a report containing item discrimination and reliability analyses.